USArrests: Violent Crime Rates by U.S. State

Description

USArrests contains statistics, in arrests per 100,000 residents, for assault, murder, and rape in each of the 50 U.S. states in 1973. It also includes the percentage of the population living in urban areas.

Usage

datasets::USArrests
               Murder Assault UrbanPop Rape
Alabama          13.2     236       58 21.2
Alaska           10.0     263       48 44.5
Arizona           8.1     294       80 31.0
Arkansas          8.8     190       50 19.5
California        9.0     276       91 40.6
Colorado          7.9     204       78 38.7
Connecticut       3.3     110       77 11.1
Delaware          5.9     238       72 15.8
Florida          15.4     335       80 31.9
Georgia          17.4     211       60 25.8
Hawaii            5.3      46       83 20.2
Idaho             2.6     120       54 14.2
Illinois         10.4     249       83 24.0
Indiana           7.2     113       65 21.0
Iowa              2.2      56       57 11.3
Kansas            6.0     115       66 18.0
Kentucky          9.7     109       52 16.3
Louisiana        15.4     249       66 22.2
Maine             2.1      83       51  7.8
Maryland         11.3     300       67 27.8
Massachusetts     4.4     149       85 16.3
Michigan         12.1     255       74 35.1
Minnesota         2.7      72       66 14.9
Mississippi      16.1     259       44 17.1
Missouri          9.0     178       70 28.2
Montana           6.0     109       53 16.4
Nebraska          4.3     102       62 16.5
Nevada           12.2     252       81 46.0
New Hampshire     2.1      57       56  9.5
New Jersey        7.4     159       89 18.8
New Mexico       11.4     285       70 32.1
New York         11.1     254       86 26.1
North Carolina   13.0     337       45 16.1
North Dakota      0.8      45       44  7.3
Ohio              7.3     120       75 21.4
Oklahoma          6.6     151       68 20.0
Oregon            4.9     159       67 29.3
Pennsylvania      6.3     106       72 14.9
Rhode Island      3.4     174       87  8.3
South Carolina   14.4     279       48 22.5
South Dakota      3.8      86       45 12.8
Tennessee        13.2     188       59 26.9
Texas            12.7     201       80 25.5
Utah              3.2     120       80 22.9
Vermont           2.2      48       32 11.2
Virginia          8.5     156       63 20.7
Washington        4.0     145       73 26.2
West Virginia     5.7      81       39  9.3
Wisconsin         2.6      53       66 10.8
Wyoming           6.8     161       60 15.6

Format

A data frame with 50 observations and four variables:

Variable Type Description
Murder Numeric Murder arrests per 100,000 residents
Assault Numeric Assault arrests per 100,000 residents
UrbanPop Numeric Percent of the population living in urban areas
Rape Numeric Rape arrests per 100,000 residents

Note

USArrests contains the data as published in McNeil’s monograph. A review of Table 21 in the Statistical Abstracts of the United States 1975 reveals a transcription error for Maryland. McNeil also used the same “round to even” rule as R’s round() function, as noted by Daniel S. Coven (Arizona).

The example below corrects the Maryland value and restores the original half-percentage values.

Source

  • World Almanac and Book of Facts 1975 (crime rates).
  • Statistical Abstracts of the United States 1975, p. 20 (urban rates), possibly available online.

References

McNeil, D. (1977). Interactive Data Analysis: A Practical Primer. John Wiley & Sons. ISBN 978-0471026310.

See Also

The other state data sets in R’s datasets package.

Examples

data("USArrests", package = "datasets")

summary(USArrests)
     Murder          Assault         UrbanPop          Rape      
 Min.   : 0.800   Min.   : 45.0   Min.   :32.00   Min.   : 7.30  
 1st Qu.: 4.075   1st Qu.:109.0   1st Qu.:54.50   1st Qu.:15.07  
 Median : 7.250   Median :159.0   Median :66.00   Median :20.10  
 Mean   : 7.788   Mean   :170.8   Mean   :65.54   Mean   :21.23  
 3rd Qu.:11.250   3rd Qu.:249.0   3rd Qu.:77.75   3rd Qu.:26.18  
 Max.   :17.400   Max.   :337.0   Max.   :91.00   Max.   :46.00  
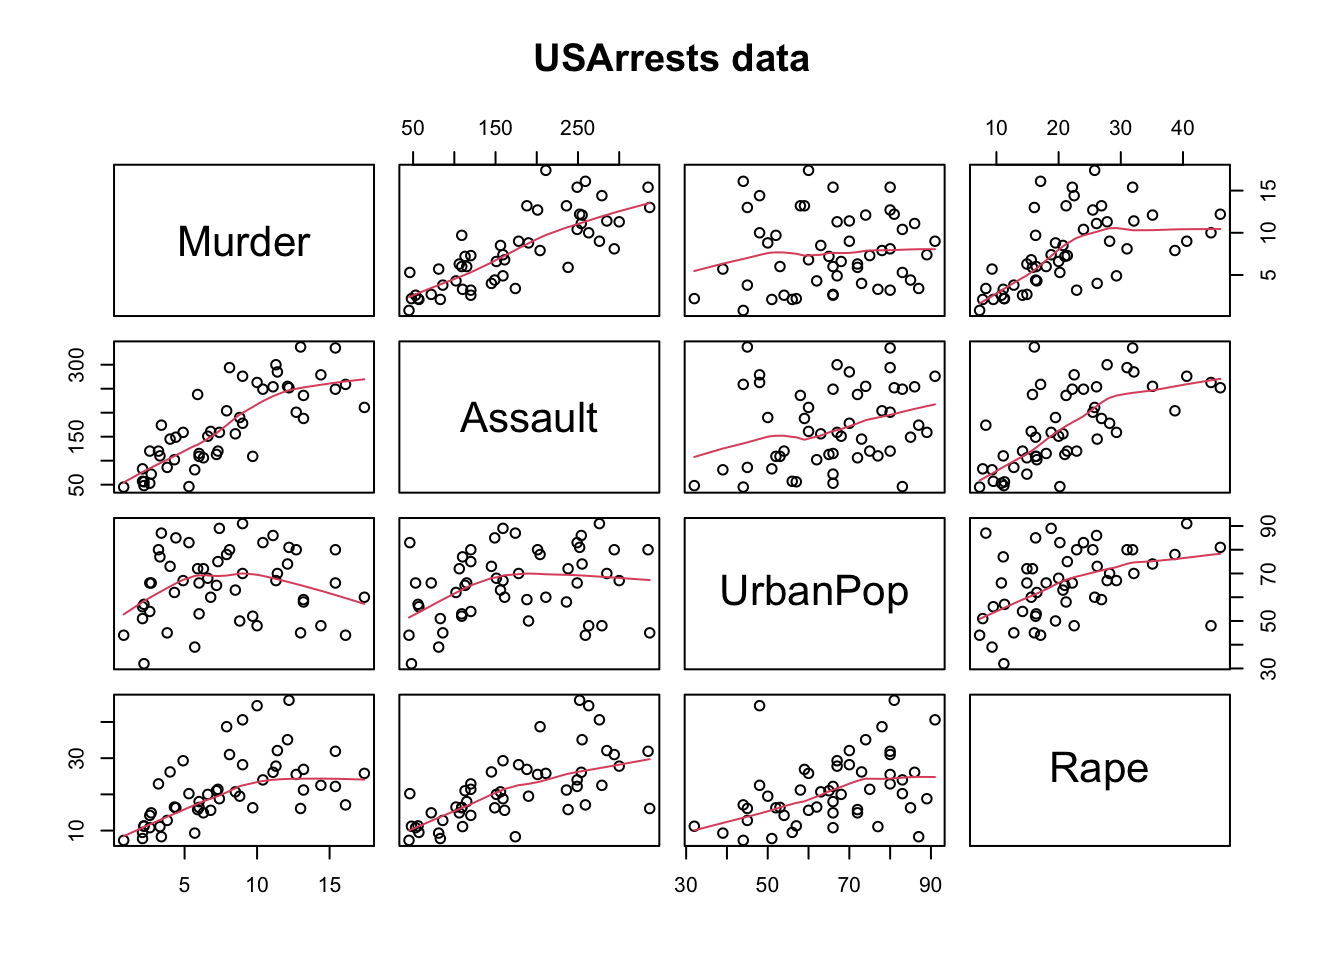
graphics::pairs(USArrests,
                panel = graphics::panel.smooth,
                main = "USArrests data")

# Difference between USArrests and its correction
USArrests["Maryland", "UrbanPop"]
[1] 67
UA.C <- USArrests
UA.C["Maryland", "UrbanPop"] <- 76.6

# Adjust the remaining percentages ending in .5
s5u <- c("Colorado", "Florida", "Mississippi", "Wyoming")
s5d <- c("Nebraska", "Pennsylvania")
UA.C[s5u, "UrbanPop"] <- UA.C[s5u, "UrbanPop"] + 0.5
UA.C[s5d, "UrbanPop"] <- UA.C[s5d, "UrbanPop"] - 0.5

# UA.C is now a corrected version of USArrests