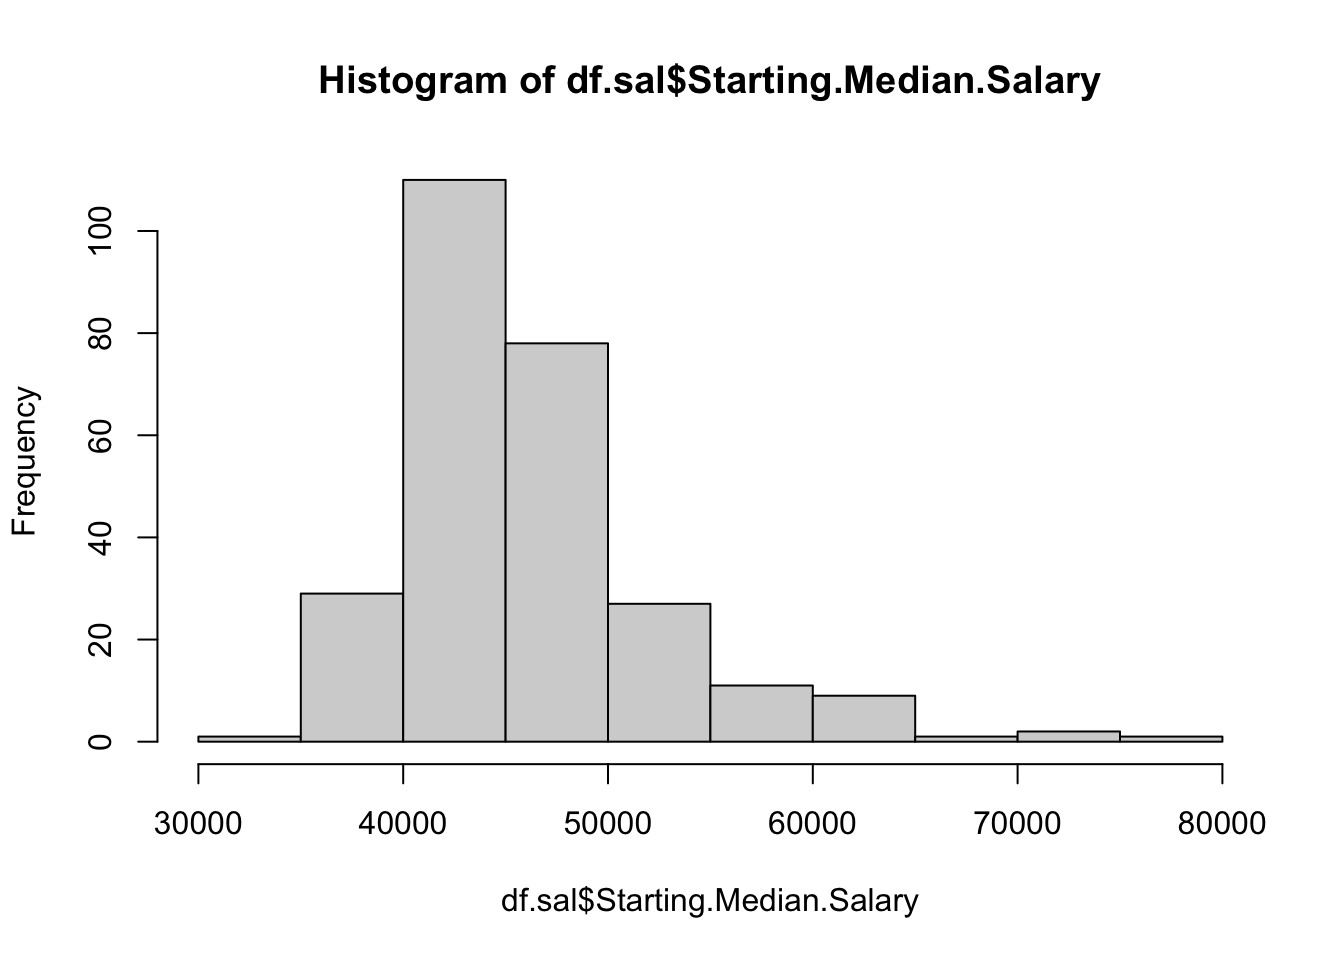
Using relevant information in R to give a thorough description of the variable Starting.Median.Salary. Mention properties of location, spread, and describe the shape (i.e., skewness) of the distribution.
Show solution
The typical starting median salary is about $44,700 (median), with an average of about $46,068. The highest reported starting median salary is $75,500, from the California Institute of Technology, while the lowest is $34,800, from Morehead State University. The middle 50% of schools have starting median salaries ranging from $42,000 to $48,300. The distribution is right-skewed.
summary(df.sal$Starting.Median.Salary)
   Min. 1st Qu.  Median    Mean 3rd Qu.    Max.
  34800   42000   44700   46068   48300   75500
hist(df.sal$Starting.Median.Salary)
Calculate the z-scores of Starting.Median.Salary and Mid.Career.Median.Salary and store the z-scores as separate variables (zstarting and zmid, respectively) in the data frame.
Print the information of schools whose zstarting is greater than 2.
Show solution
df.sal[df.sal$zstarting >2, ]
                                    School.Name School.Type
1   Massachusetts Institute of Technology (MIT) Engineering
2      California Institute of Technology (CIT) Engineering
3                           Harvey Mudd College Engineering
4  Polytechnic University of New York, Brooklyn Engineering
5                                  Cooper Union Engineering
6         Worcester Polytechnic Institute (WPI) Engineering
7              Carnegie Mellon University (CMU) Engineering
8        Rensselaer Polytechnic Institute (RPI) Engineering
11              Stevens Institute of Technology Engineering
88                         Princeton University  Ivy League
89                              Yale University  Ivy League
90                           Harvard University  Ivy League
91                   University of Pennsylvania  Ivy League
92                           Cornell University  Ivy League
94                          Columbia University  Ivy League
95           University of California, Berkeley       State
   Starting.Median.Salary Mid.Career.Median.Salary
1                   72200                   126000
2                   75500                   123000
3                   71800                   122000
4                   62400                   114000
5                   62200                   114000
6                   61000                   114000
7                   61800                   111000
8                   61100                   110000
11                  60600                   105000
88                  66500                   131000
89                  59100                   126000
90                  63400                   124000
91                  60900                   120000
92                  60300                   110000
94                  59400                   107000
95                  59900                   112000
   Mid.Career.10th.Percentile.Salary Mid.Career.25th.Percentile.Salary
1                              76800                             99200
2                                 NA                            104000
3                                 NA                             96000
4                              66800                             94300
5                                 NA                             80200
6                              80000                             91200
7                              63300                             80100
8                              71600                             85500
11                             68700                             81900
88                             68900                            100000
89                             58000                             80600
90                             54800                             86200
91                             55900                             79200
92                             56800                             79800
94                             50300                             71900
95                             59500                             81000
   Mid.Career.75th.Percentile.Salary Mid.Career.90th.Percentile.Salary
1                             168000                            220000
2                             161000                                NA
3                             180000                                NA
4                             143000                            190000
5                             142000                                NA
6                             137000                            180000
7                             150000                            209000
8                             140000                            182000
11                            138000                            185000
88                            190000                            261000
89                            198000                            326000
90                            179000                            288000
91                            192000                            282000
92                            160000                            210000
94                            161000                            241000
95                            149000                            201000
   zstarting     zmid
1   4.075029 2.934368
2   4.589640 2.725107
3   4.012652 2.655354
4   2.546792 2.097325
5   2.515603 2.097325
6   2.328472 2.097325
7   2.453226 1.888065
8   2.344066 1.818311
11  2.266095 1.469544
88  3.186156 3.283136
89  2.032181 2.934368
90  2.702734 2.794861
91  2.312878 2.515847
92  2.219312 1.818311
94  2.078964 1.609051
95  2.156935 1.957818
Print the information for Rutgers University. Give an interpretation for its zstarting and zmid values.
Show solution
Rutgers University’s starting median salary is 0.66 standard deviations above the mean, and its mid-career median salary is 0.55 standard deviations above the mean.
What is the mean of zstarting for only the liberal arts colleges? What about the mean of zmid for liberal arts colleges? What conclusion can you draw by comparing the two means?