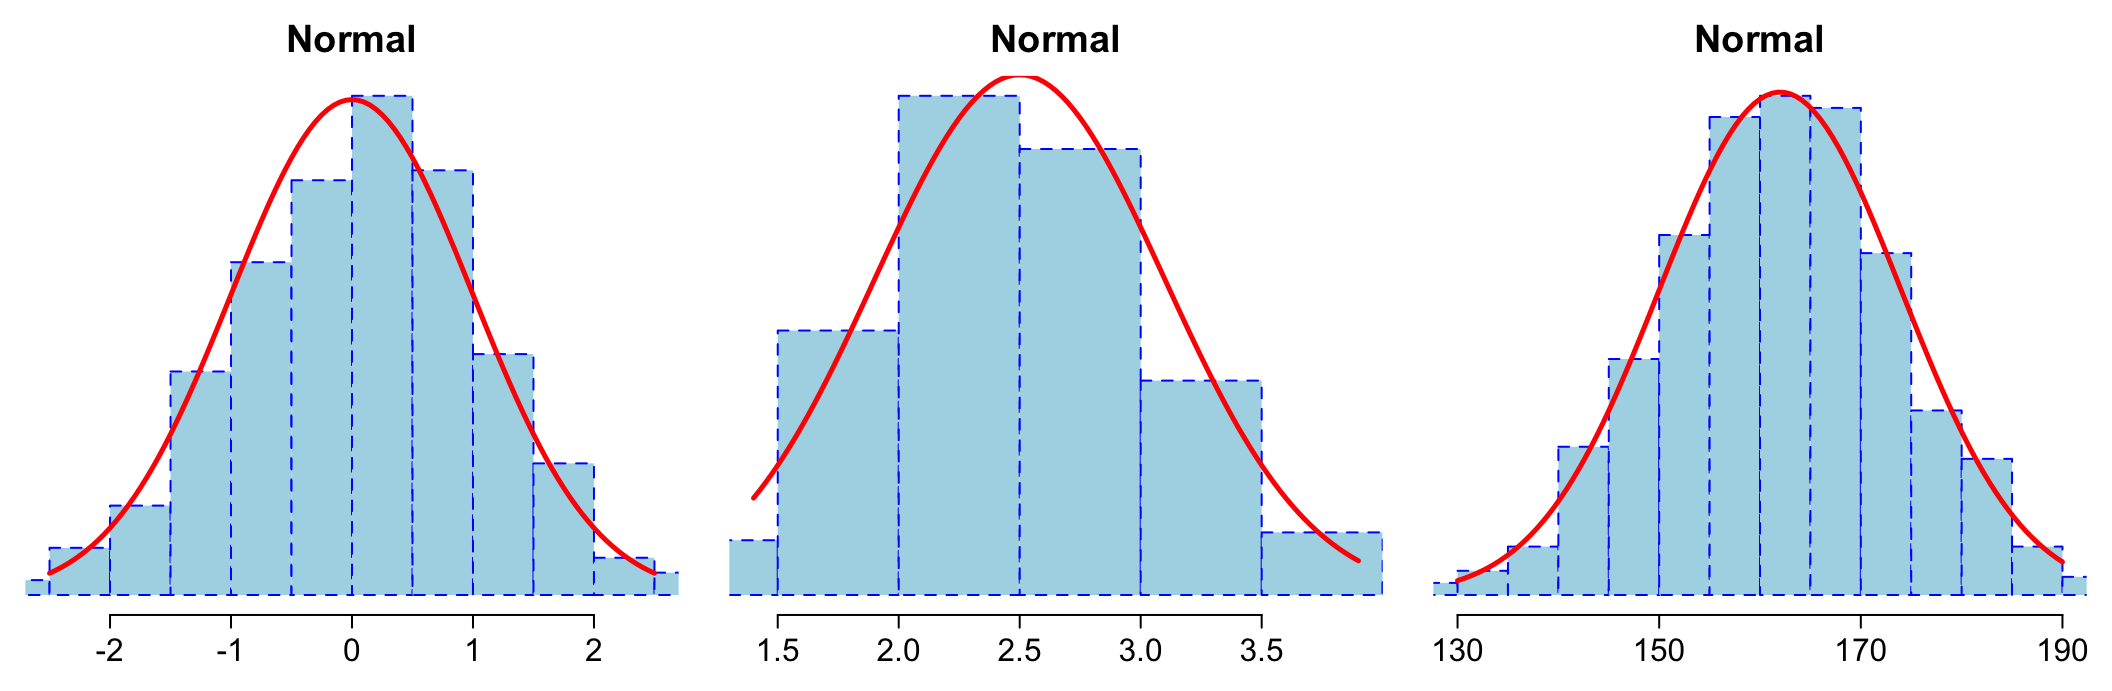
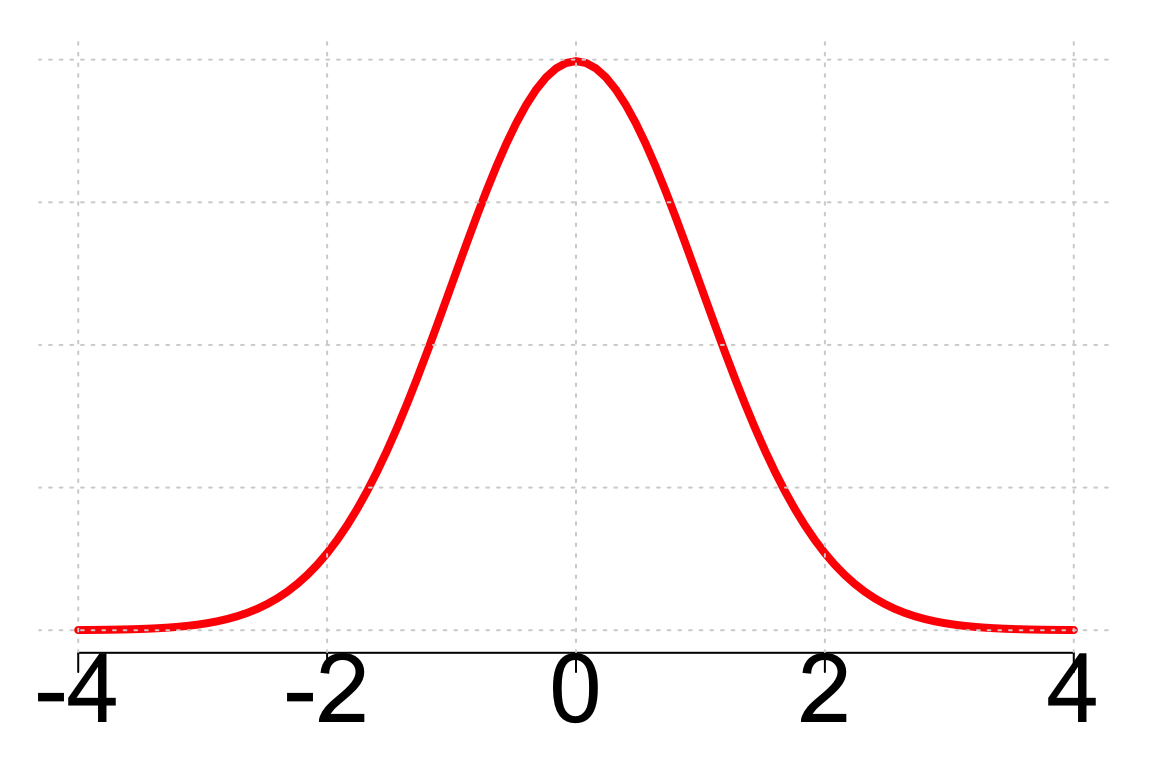
Range of normal distribution: \(-\infty\) to \(\infty\)
A normal distribution is entirely determined by its mean (location) and standard deviation (spread)
Standard normal: mean = 0, standard deviation = 1
Normal distribution was mathematically developed by Carl Gauss (1777–1855) and is also called Gaussian distribution
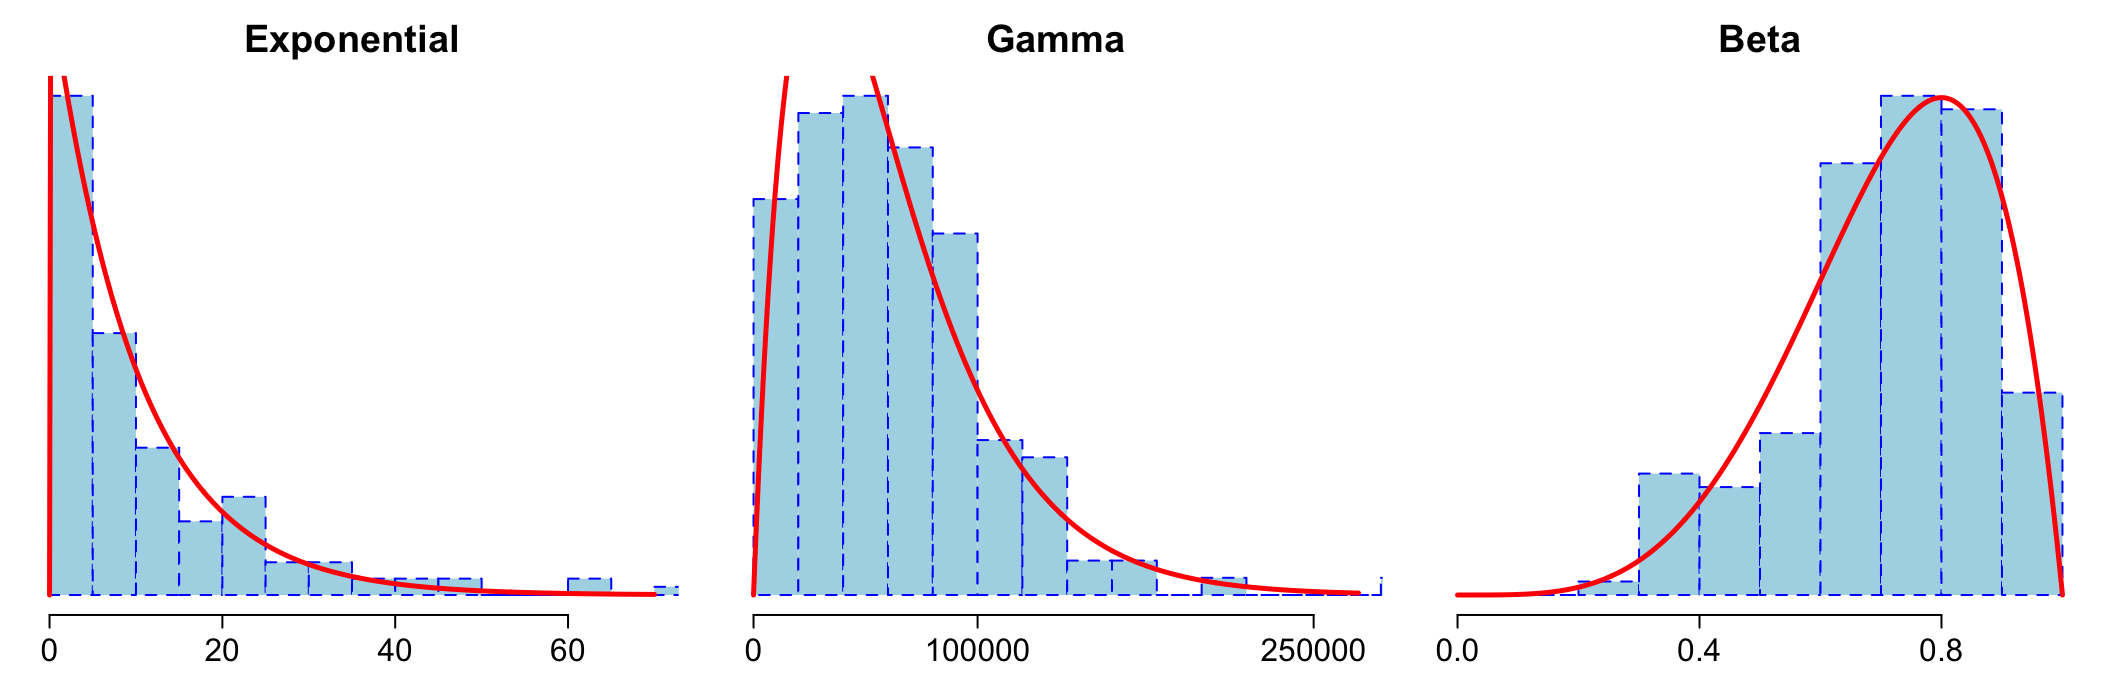
Examples of non-normal distributions
Probablity calculation
Suppose a score follows a standard normal distribution (so we’ll call it a z-score). Probablities can be obtained with the pnorm function in R.
# P(Z < 1)pnorm(1)
[1] 0.8413447
# P(Z > -0.5)1-pnorm(-0.5)
[1] 0.6914625
# P(2 < Z < 3)pnorm(3) -pnorm(2)
[1] 0.02140023
pnorm(*) always gives \(P(Z \leq *)\)
For normal distribution, for example, \(P(2<X <3) = P(2 \le X \le 3) = P(2 < X \le 3)\)
(Optional) notes
Mathematically, similar probablity calculations require integration under the curve. In the case of the normal distribution, however, this integration does not exist in closed form, so numeric approximation is always required. That’s why people typically rely on software (or tables) to obtain these probabilities.
Locating a score
Suppose we want to find the score that corresponds to a given probability in a standard normal distribution. This can be done using the qnorm function in R.
# Find the score corresponding to the 85th percentileqnorm(0.85)
[1] 1.036433
# Find the score corresponding to the 5th percentileqnorm(0.05)
[1] -1.644854
The percentage you put in qnorm() should be the percentile, i.e., the proportion BELOW the desired score.
Examples
Suppose Z follows a standard normal distribution.
What is the probability that Z is greater than 0?
What is the probability that Z is less than 1.25?
What percentage of scores are between -2 and -2.5?
What’s the value of the score such that the probability of being less than it is 90%?
What’s the value of the score such that the probability of being greater than it is 30%?
If you want to be in the top 15%, how many points do you have to score?
What is the score that is better than 80% of scores?
What is the percentile rank of 0.7?
What is the 20th percentile of the z-score?
What percentage of people scored above 2 or below -2?
Specifying mean and standard deviation
In practice, many variables do not follow a standard normal. The R functions pnorm and qnorm can be used with the mean and sd arguments.
# P(X<-1) for standard normalpnorm(-1, mean =0, sd =1)
[1] 0.1586553
pnorm(-1)
[1] 0.1586553
# P(X<80) for normal with mean 75 and sd 8pnorm(80, mean =75, sd =8)
[1] 0.7340145
# Find the score corresponding to the 90th percentileqnorm(0.9, mean =75, sd =8)
[1] 85.25241
Fact: if a value follows a normal distribution, its z-score follows a standard normal distribution (intuition: z-score is a linear transformation that does not change the normal shape).
Example: pregnancy length
Suppose the length of human pregnancy follows a normal distribution with mean 266 days and standard deviation 16 days (in reality, the distribution is slightly left skewed).
What percentage of babies are born before 250 days?
What percentage of babies are born between 260 and 265 days?
What is the probablity that a pregnancy lasts for more than 280 days?
What is the 10th percentile for the length of pregnancy?
What would be a very long pregnancy (top 1%)?
Example: SES
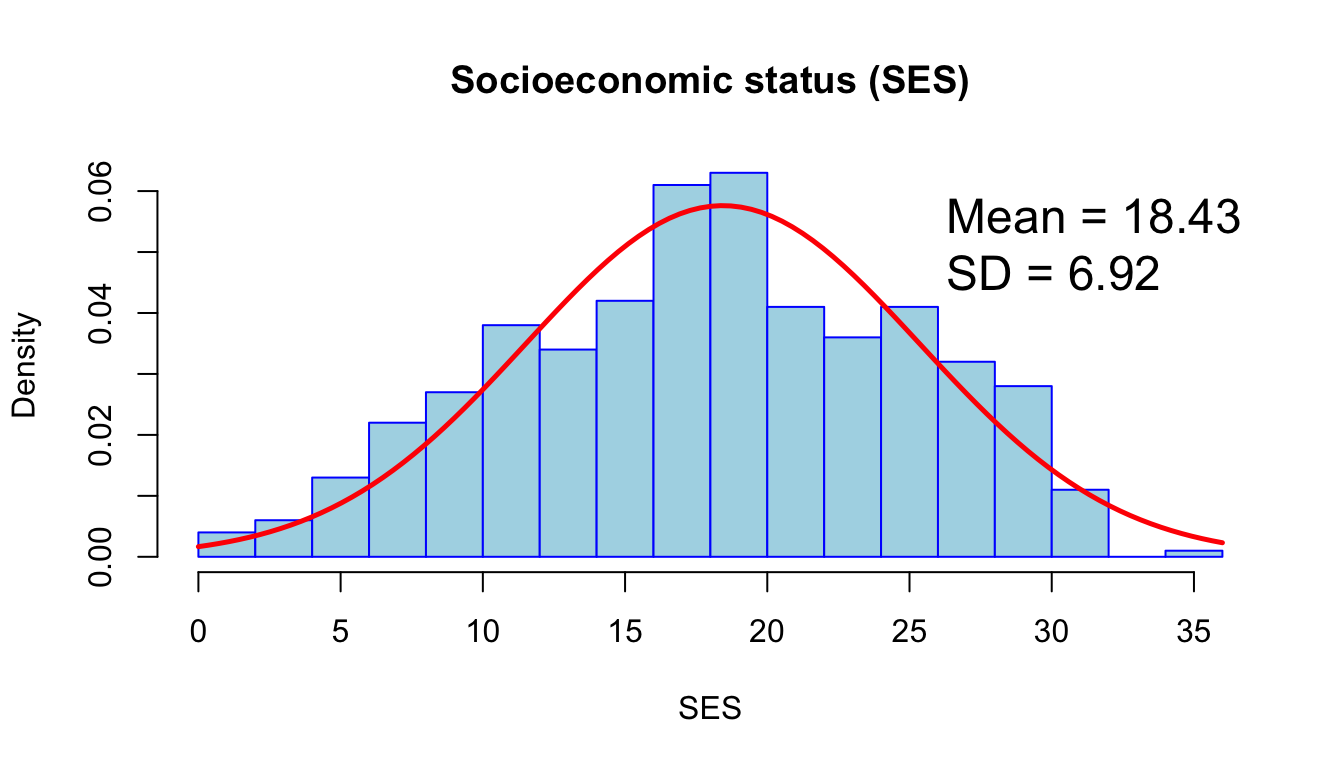
Consider the socioeconomic status (SES) in the NELS dataset.
Find the proportion of students scoring \(\le 26\).
Find the 80th percentile of SES.
Now, we see that the distribution of SES can be well approximated by a normal distribution. Using the normal distribution, re-answer the above questions to compare.
Example: 68% - 95% - 99.7% rule
For something that follows a normal shape, what percentage of values fall within one standard deviation of the mean?
What range am I looking for if:
mean = 114 and SD = 20 (e.g., movie length in minutes)
mean = 98.2 and SD = 0.7 (e.g., body temperature in F)
mean = 0 and SD = 1 (e.g., standard normal)
Now, what percentage of values fall within two standard deviations of the mean? Three standard deviations?
Example: 68% - 95% - 99.7% rule
The 68% - 95% - 99.7% rule gives a very convenient way to understand data when the data is normal.
For instance, we know from biological knowledge that human heights can be well approximated by a normal distribution. If we look up a country with a known mean and standard deviation, we know that most people (95%) in that country have heights between:
It also provides an intuition that z-scores above 2 and below -2 are very rare (5%); z-scores above 5 (for example) and below -5 (called a 5-sigma event) are essentially impossible, provided the data is at least approximately normal.