Chapter 1: Introduction
STAT117: Introduction to Statistics
Data format
For any (tabular) dataset, the first step is to look at:
- What are the subjects?
- What are the variables for the subjects?
Lecture notes
- What are the subjects? \(\rightarrow\) Look at the rows (student, in this case)
- What are the variables? \(\rightarrow\) Look at the columns (e.g., id, advmath8, urban, etc.)
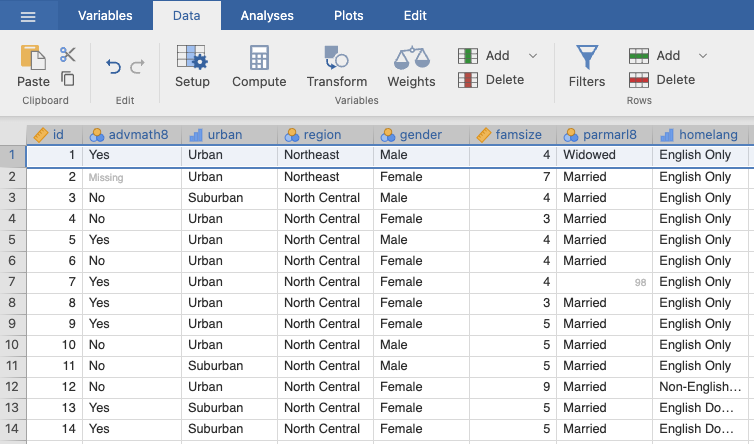
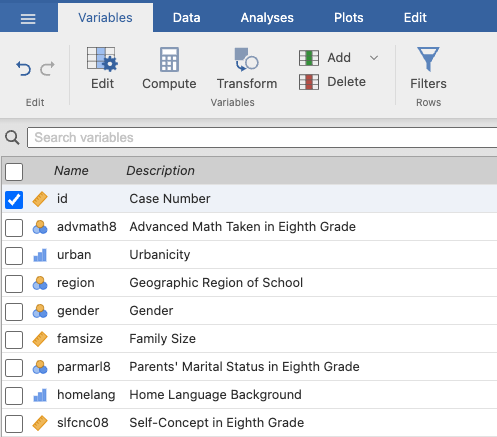
- In the following screenshots, top table is the data view in Jamovi; bottom table is the variable view.
Example (NELS.sav)
Lecture notes
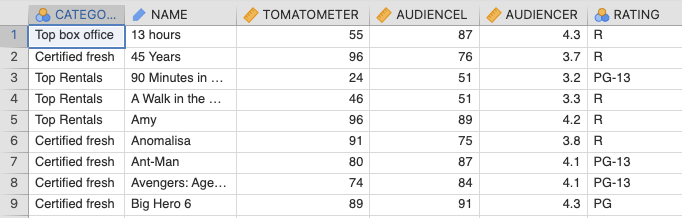
- Subjects \(\rightarrow\) row (movie)
- Variables \(\rightarrow\) column (Category, Name, Rating, etc.)
Show Narrative Summary
Every dataset should be organized as a rectangular table: rows and columns. To familiarize yourself with a new dataset, first ask, “what does each row/column represent?”
In the NELS data, each row is a student (a subject), and each column is a piece of information recorded about that student (a variable), such as id, whether the student took advanced math in 8th grade (advmath8), the urbanicity of their school (urban), their geographic region, gender, and family size (famsize).
In the Combined Class Movies data, each row is a movie (a subject), and each column is a piece of information recorded about that movie (a variable), such as Category, Name, Rating, etc.
Jamovi provides two different display windows: The Data View looks like a spreadsheet of the actual data. The Variable View is a separate table listing all the variables and their descriptions.
As an example, the NELS data contains information for 500 students, with 48 variables recorded for each student. Hence, the data view shows 500 rows and 48 columns, and the variable view shows a list of 48 variables.Variables
A variable can have different values:
- Subject ID: 1, 2, 3, 4, …
- Age: 12, 13, 14, 15
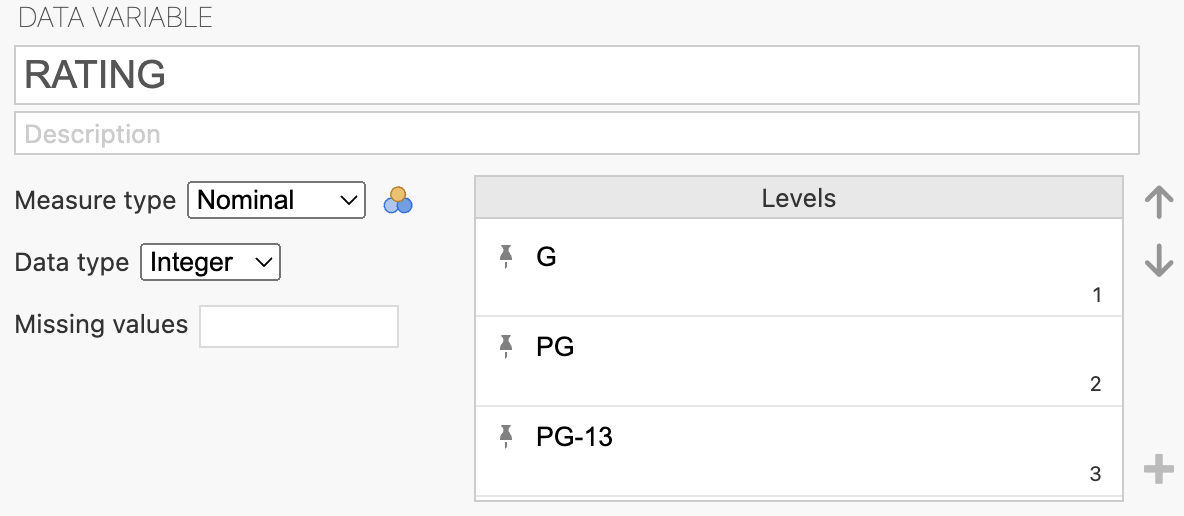
- Rating: NC-17, R, PG-13, PG, G
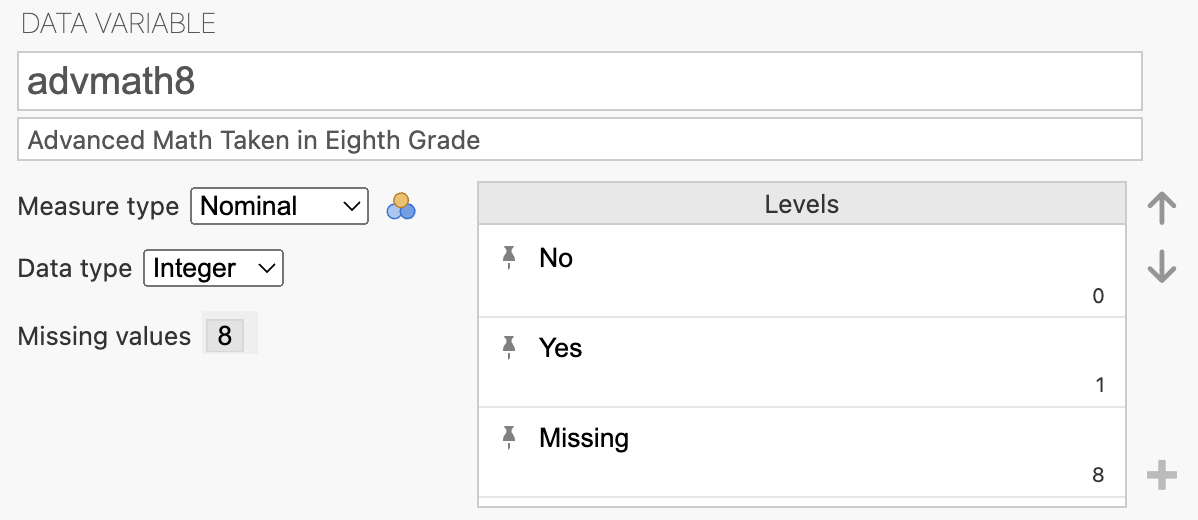
- Whether or not the student has taken advanced math in 8th grade (advmath8): Yes, No
For the ease of analysis, non-numeric values are typically given a numeric coding
Show Narrative Summary
Variables can have different values (i.e., they “vary”): Northeast is NOT a variable; region is a variable.
Importantly, variables can take on very different kinds of values — some are simple counts or IDs (Subject ID, Age), some are ordered categories (movie RATING), and some are yes/no responses (took advanced math in 8th grade).