Lecture 6: Model Based Inference

DATA 352/551: Modeling and Simulation

Set-up

Our goal is to estimate the incubation period of COVID-19, or, more precisely, the distribution of the incubation period.

  • What properties of this distribution are especially of interest?
  • What are some challenges of obtaining data for the incubation period estimation?

Set-up

This lecture is a very brief introduction to model-based inference. Material is based on The Incubation Period of Coronavirus Disease 2019 (COVID-19) From Publicly Reported Confirmed Cases: Estimation and Application, Lauer et. al., Annals of Internal Medicine, published online on March 10, 2020. Data and code are publically available.

Please download:

Data

Open nCoV-IDD-data-dictionary.xlsx and find the following information to get a sense of the data. Submit your answers here for an assignment grade.

a. What do these variable names stand for: EL, ER, SL, SR, PL, PR?

b. Find the case whose UID is U0021. When did he arrive in Wuhan?  When did he leave Wuhan?  If you had to make one estimate of his incubation period, what would it be?

c. Find the case whose UID is U0001.  Why would it be very hard to determine this person's incubation period?

d. Find another case whose incubation period would be hard to determine.  Discuss why.

Data

  • Import nCov_simple.csv to R.
ncov_simple <- read.csv('nCoV_simple.csv')
# or:
# ncov_simple <- read.csv(file.choose())
head(ncov_simple)
  incubation  age gender SL       SR EL       ER
1       9.06 54.5   Male 53 53.50000 39 49.37500
2       9.50 34.5   Male 33 33.99931 14 33.99931
3       4.00 56.0   Male 48 48.99931 40 48.99931
4       0.31 58.0 Female  0 53.99931  0 53.37500
5       2.50 66.0   Male 33 33.99931 28 33.99931
6       5.00 28.0   Male 50 50.99931 43 47.99931

Statistical inference

Print some summary statistics of the incubation period:

summary(ncov_simple$incubation)
   Min. 1st Qu.  Median    Mean 3rd Qu.    Max. 
  0.310   2.562   4.000   4.108   5.375  11.000 
  • Does this imply that the true median of incubation period is 4 days? Does this imply that the true maximum of the incubation period is 11 days?

  • Statistical inference is the process of making “an educated guess” about the parameters of interest (such as the median), based on data.

Model-based Inference

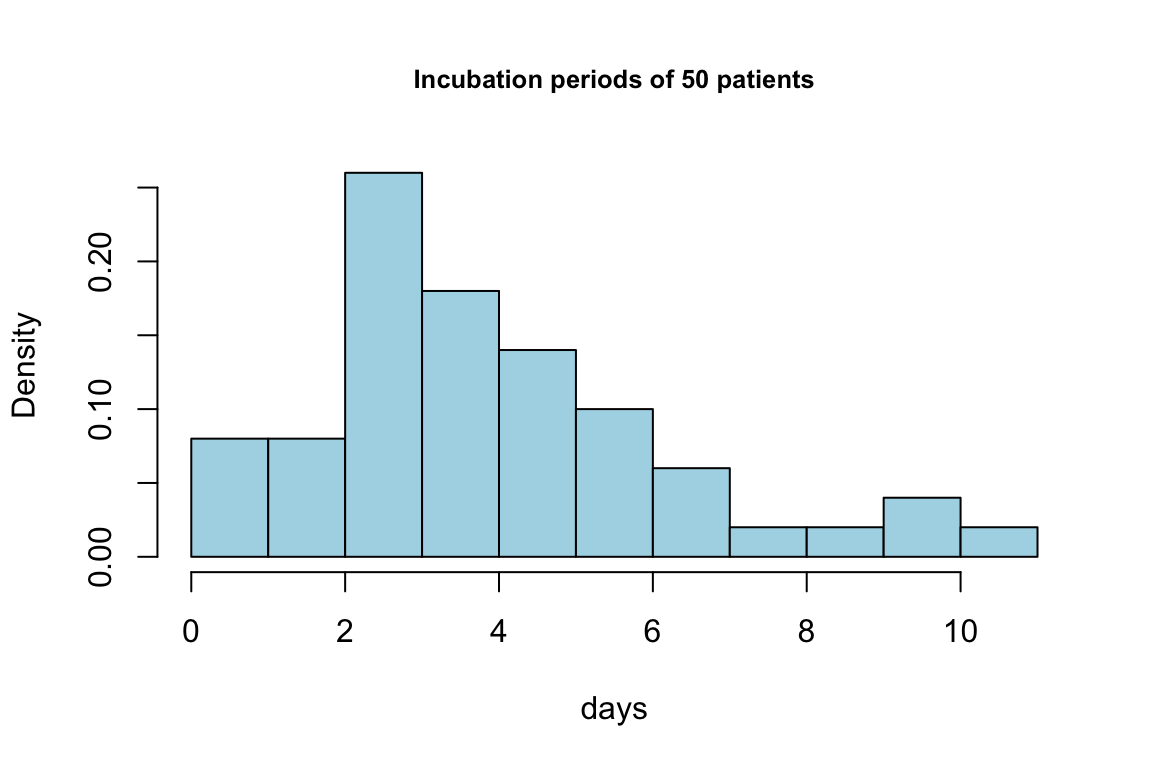
Show code
hist(ncov_simple$incubation,main='Incubation periods of 50 patients',
     col='lightblue',freq = F,
     xlab='days',nclass=10,cex.main=0.8)

We want to model the incubation period with a pre-determined distribution (e.g., Normal) that can be specified by a fixed number of parameters (e.g., mean and variance). This is called a “parametric” method.

  • Step 1: Choose a model

  • Step 2: Estimate parameters of the model

Estimate parameters
Use R to perform parameter estimation of the chosen model

library('MASS')  #need to install first, if not installed
result <- fitdistr(ncov_simple$incubation,'normal')
result$estimate
    mean       sd 
4.107600 2.316638 
result$sd
     mean        sd 
0.3276220 0.2316638 
result$loglik
[1] -112.9528

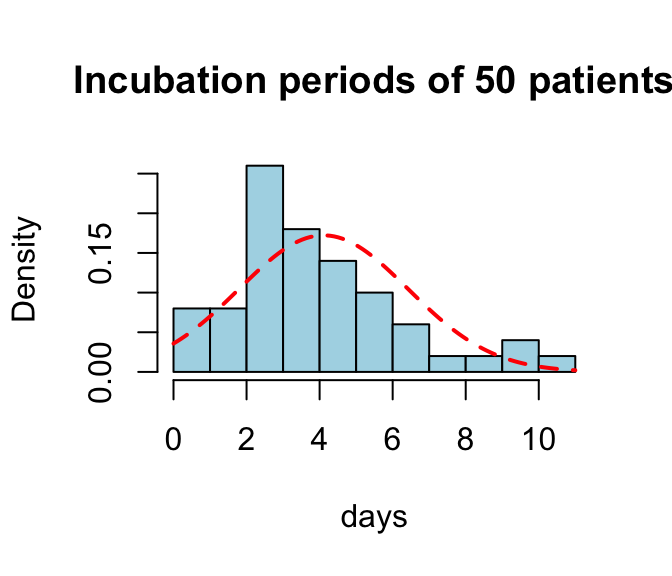
Estimate parameters

hist(ncov_simple$incubation,
     main='Incubation periods of 50 patients',
     col='lightblue',prob=T,xlab='days',nclass=10)
curve(dnorm(x,mean=result$estimate[1],sd=result$estimate[2]),
      add=T,col='red',lwd=2,lty='dashed')

(Log) likelihood

  • The likelihood function, usually written as \(L(\mu, \sigma | \textit{data})\), is a function of model parameters.

  • Parameter values that “fit the data better” will produce a larger likelihood, or, equivalently, a larger log-likelihood.

# "Hand calculation" of the log likelihood
log(prod(dnorm(ncov_simple$incubation,mean=8,sd=1.8)))
[1] -233.651

Show code
par(mfrow=c(1,2))
hist(ncov_simple$incubation,main='normal, mean=4.11, SD=2.32 \n loglikelihood = -112.95',
     col='lightblue',freq = F,
     xlab=NA,nclass=10)
curve(dnorm(x,mean=4.1076,sd=2.3166),
      add=T,col='red',lwd=2,lty='dashed')
hist(ncov_simple$incubation,main='normal, mean=8, SD=1.8 \n loglikelihood = -233.65',
     col='lightblue',freq = F,
     xlab=NA,nclass=10)
curve(dnorm(x,mean=8,sd=1.8),
      add=T,col='red',lwd=2,lty='dashed')
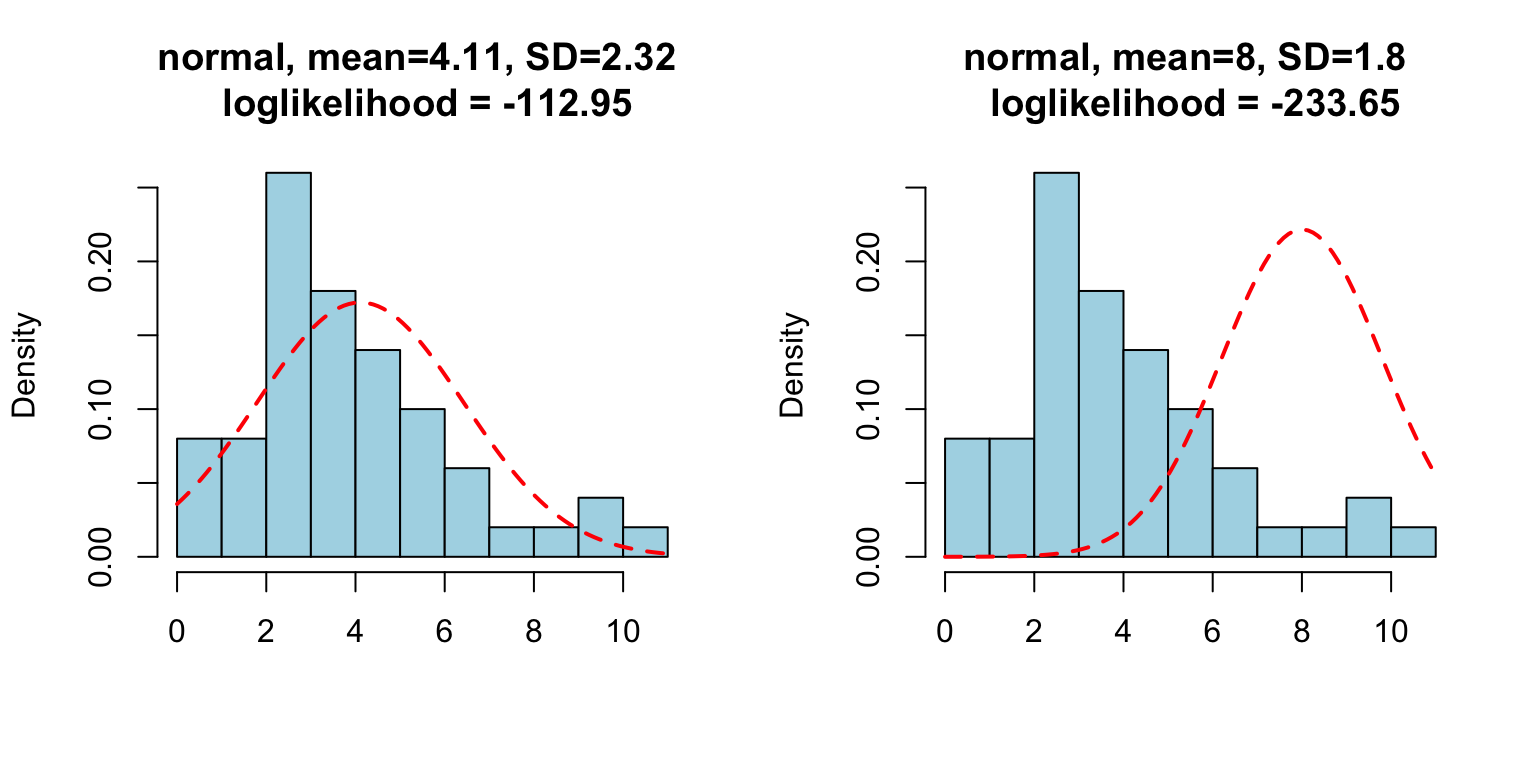
  • Estimates obtained by fitdistr (i.e., 4.1076 and 2.3166 here) are the values that maximize the log-likelihood (called maximum likelihood estimators)

Some other models

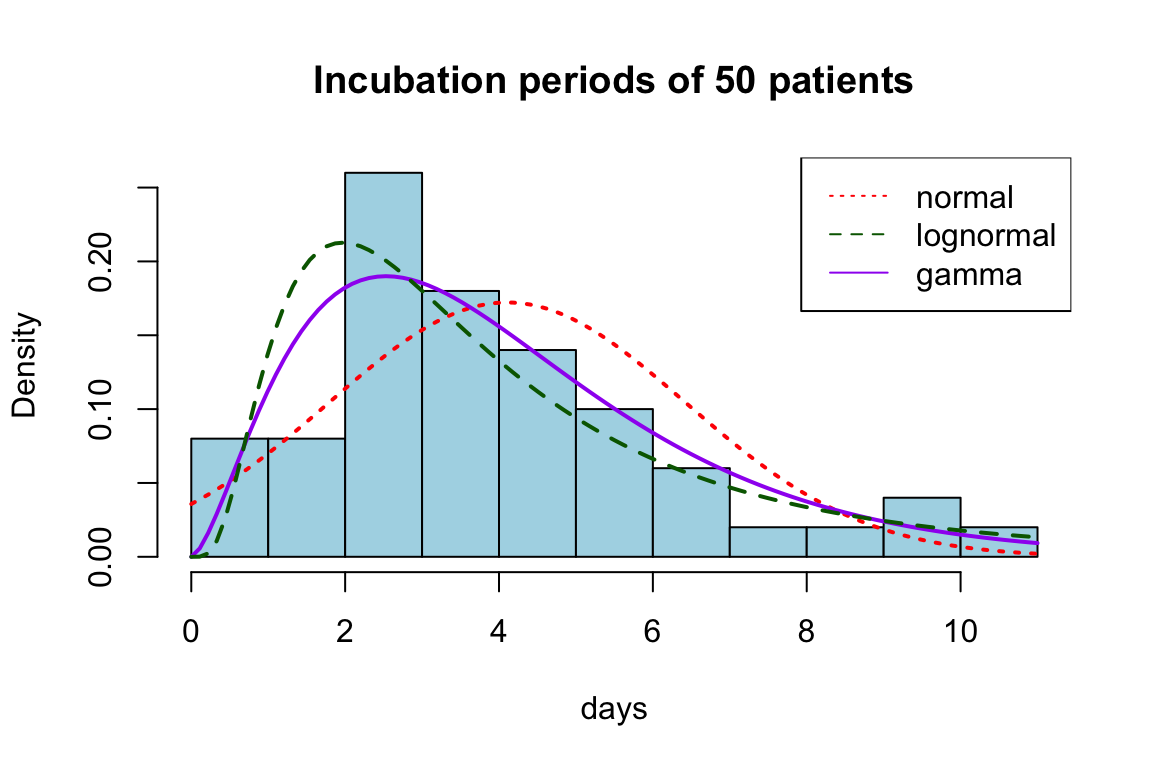
These distributions have the correct sample space of \([0, \infty)\) for the incubation period and allow more flexibility in shape (doesn’t have to be symmetric)

  • Lognormal (in R: dlnorm)
  • Gamma (in R: dgamma)
  • Weibull (in R: dweibull)

Recall:

  • Step 1: Choose a model
  • Step 2: Estimate the parameters

Lognormal

  • Estimate the parameters of the lognormal model
result <- fitdistr(ncov_simple$incubation,'lognormal',lower=0.01)
result$estimate
  meanlog     sdlog 
1.2092543 0.7307774 
  • Add the estimated density to histogram
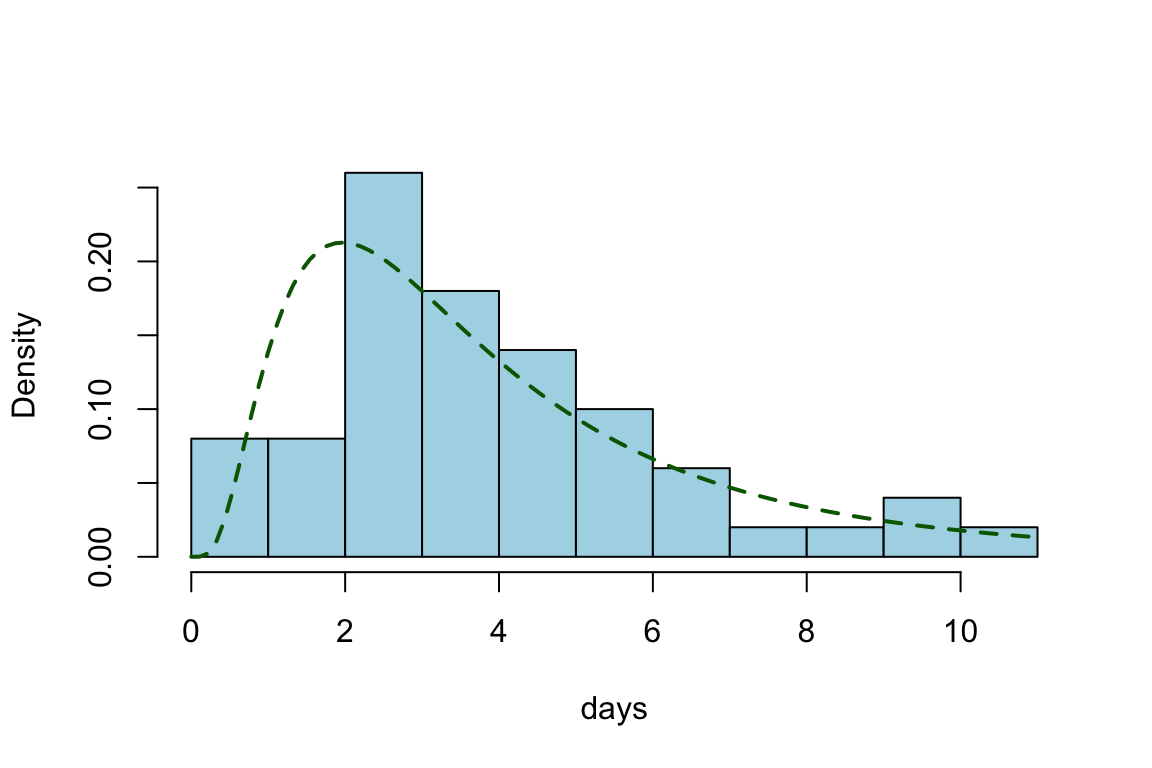
hist(ncov_simple$incubation,main=NA,
     col='lightblue',prob=T,xlab='days',nclass=10)
curve(dlnorm(x,meanlog=result$estimate[1],sdlog=result$estimate[2]),
      add=T,col='darkgreen',lwd=2,lty='dashed')

Lognormal

  • Calculate the log-likelihood
# by hand
log(prod(dlnorm(ncov_simple$incubation,
                meanlog=result$estimate[1],sdlog=result$estimate[2])))
[1] -115.7273
# in R
result$loglik
[1] -115.7273
  • Based on likelihood, which model better fits data? Lognormal or normal?

  • In addition, using this model and estimated parameters, we can answer many questions:

    • What is the probability that the incubation period is shorter than 14 days?
    • What is the probability that the incubation period is longer than 5 days?
    • Simulate incubation periods of future patients:

Exercise: gamma

  1. Estimate the parameters of the gamma distribution.

  2. Add the estimated density to the histogram.

  3. Calculate the log-likelihood of the gamma model. Based on likelihood, does the gamma model fit data better or worse than the normal and lognormal models?

  4. Using the gamma model and estimated parameters, what is the probability that the incubation period is shorter than 14 days?

Discussion on model selection

  • “Modeling is more of an art than a science”
  • “All models are wrong; some models are useful”
  • Formal statistical procedures exist for model selection:
  • People also consider:

Summary

We want to model a set of data \(Y_1, \ldots, Y_n\), where \(Y_i\) is the incubation period of the ith person. The models we did in this lecture can be formally written as (using the gamma model as an example): \[Y_1, \ldots, Y_n \sim (iid) \ \textit{gamma}(\alpha, \beta)\]

We can build more complicated models:

  • Bayesian models: \[Y_1, \ldots, Y_n | \alpha, \beta \sim (iid) \ \textit{gamma}(\alpha, \beta)\] \[\alpha, \beta \sim \textit{some prior distribution}\]

  • Models with covariates (e.g. regression): \[Y_1, \ldots, Y_n \sim f(X_{1i}, X_{2i}) + \epsilon_i\]

  • Hierachical models: \[Y_1, \ldots, Y_n | \theta_1 \ldots \theta_n \sim \textit{lognormal}(\mu_{\theta_i}, \sigma_{\theta_i})\] \[\theta_1 \ldots \theta_n \sim \textit{normal}(\mu, \sigma)\]